
Realty Income brand themselves as “the Monthly Dividend Company”
Realty Income Corporation (NYSE:O) is a so called REIT, a Real Estate Investment Trust. REITs invest in properties and/or mortgages, and receive special tax considerations. REITs have to pay at least 90% of its taxable profit in dividends and 75% of their gross income must come from properties. This is what makes them quite attractive to income investors.
Realty Income has real estate assets for $12 billion (cost basis) diversified in more than 4000 properties, spanning 49 states and Puerto Rico. About 40% of Realty Incomes 236 tenants are of investment grade, and they go across 47 industries.

Realty Incomes top 20 tenants (% of revenue)

Realty Incomes occupancy rate 1992 – Q3 2015The broad spectrum of tenants combined with their impressive occupancy rate is what fuels Realty Incomes steadily increasing monthly dividend.But for how long can they keep increasing the dividend?
Time for numbers, I look at the Q3 report for 2015 and the 2014 annual report.
First of all it needs to be noted that since we are looking at a REIT, normal earnings are quite useless in terms of evaluating the business. What we need to look at is AFFO, Adjusted Funds From Operations. Generally AFFO equals the REITs Funds From Operations (FFO), adjusted for the reoccurring capital expenditures used to maintain the the quality of the physical assets.
It is important to note that AFFO is a non-GAAP measure, but we’ll have to make do.
Total Assets less Goodwill equals $11,738,569
Total Liabilities equals $5,674,733
Total Debt / Total Assets = 0.483
Total equity = $6,063,836
Debt to Equity = 0.94
(Should be noted)
FFO available to common stockholders $ 562,889,000 (2014)
FFO per common share, basic and diluted $ 2.58
(2014) increased each year from 2010
These have both been increasing from 2012 and 2013
Total AFFO available to common stockholders $ 561,661,000 (2014)
AFFO per common share $ 2.57
(2014) increased each year from 2010
These are very close to FFO which means only minor adjustments were made.
Interest Cost $216,366,000 (2014)
Interest coverage by AFFO
(affo/interest)
= 2.6
Total Dividends paid $517,556,000 (common+preferred 2014)
Dividend coverage by AFFO
(affo/total dividends)
= 1.09
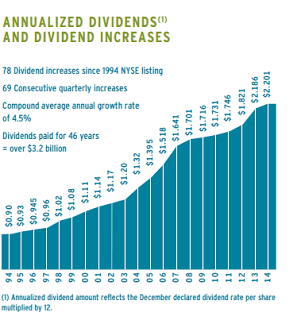
Realty Income Annualized Dividends

Realty Income AFFO per Common Share
Note that these two graphs are different in scale, but its clear that AFFO per share is increasing at at rate such that it keeps ahead of dividends per share.
Conclusions
The most difficult part to me in an analysis is drawing correct conclusions from the numbers, charts and figures. However, I’ll do my best.
The first thing you notice when you browse around Realty Incomes website is that they pay more attention to their dividend history, and how great it is to be a shareholder, than they pay to the properties they own.
First of all AFFO is close to FFO, which leaves out my worries that the adjustments would be incorrect or “shady”. (Remember Enron?) As far as the AFFO per share goes, it has been increasing since the IPO in 1994, except for the years 2007-2010. The occupancy rate is as impressive as the company’s dividend history. Occupancy has stayed between 96.6 % and 99.5 % since 1992! Realty Income has paid dividends for 46 years, with a CAGR of 4.5 %. Since IPO they have gone through with 78 increases and they have never lowered their dividend. The AFFO / Dividends is very low according to me, I would have liked to see this be at least closer to 2 or above. The growth is based on purchasing properties. This requires capital, which requires loans. Dept to Assets is at good 0.48, which means approximately half the assets are funded with equity. Realty Income has Investment Grade Credit Rating which translates into cheap loans, but we can also remember that Lehman Brothers had AAA rating minutes before their collapse.
However most of Realty Incomes leases are so called Triple-Net Leases. This means that besides rent, the tenant pays all taxes, maintenance and insurance related to the property. This provides a steady cash flow and reduces the amount of work they need to maintain their properties.
A downside to this may be the risk that the tenant poorly maintains the property, leading to a significant decrease in its value.
The rates are low now, but they will be higher. This is negative for Realty Income since higher rates means higher interest cost.To sum it up, I like Realty Income, as long as the debt does not spiral out of control, and as long as they can keep finding good properties to purchase, the dividends should be safe.
The biggest warning signs to look out for would be:
- Debt increasing in order to fund dividends
- Decreasing AFFO per share
To sum it up, I like Realty Income but currently Mr Market offers Realty Income at $ 51.18 (closing price 22-12-2015) which is close to the 52-week high $ 55.54. This gives a Price to AFFO – ratio of 20 and a Yield of 4.48%.
Prices to compare to is P/AFFO=15 gives a price per share of $ 38
Yield 5 % (at $ 2.28 annualized dividend) gives the price $ 45.6
I believe in transparency, and that’s why I also want to tell you that I currently own 20 shares of Realty Income, a number I am going to increase in the future.
Thank you for reading, please share your thoughts on my analysis with me. I would love to hear what you think!
Merry Christmas, and a Happy New Year!
-Samuraimannen
Remember, I am no advisor, always do your own research and do not make any decisions based on what I write!

Välkommen Lars!
Jag har för avsikt att attrahera en global läsarskara, men jag har funderat på att eventuellt skriva svenska inlägg om sånt som bara rör oss på den svenska marknaden 🙂
Kul att du gillar bloggen och trevligast av allt är att du stannade och lämnade en kommentar!
Hade det fint Lars-S
Bra analyser! Upptäckte din sida nu utifrån att jag följde en av dina goda kommentarer från en annan blogg. Du vill inte skriva på svenska istället eller har du för avsikt att attrahera utländska följare? Hursomhelst så gillar jag din blogg :-).
HälsarLars D