Johnson and Johnson describes themselves as a family of companies, namely 250 different companies. Together they operate in 60 countries and in three major segments: Consumer Healthcare, Medical Devices, and Pharmaceuticals.
Consumer healthcare includes Baby Care, Skin and Hair care, OTC Pharmaceuticals and Oral Health. Some examples of brands under Consumer Healthcare are Listerine, Nicorette, Pepcid, Band-Aid, Compeed, Netrogena, Johnson’s and Piz Buin.
In the Medical Devices Johnson and Johnson produces a broad range of product in the fields orthopaedic, neurovascular, surgery, vision care, diabetes care, infection prevention, cardiovascular disease, sports medicine, and aesthetics.
The Pharmaceutical segment is carried out through the Janssen companies. Here is a list of all Janssen products. And there sure is a lot of them! Janssen also concludes R&D
 Sales per segment
This is a slide from the 2015 Q4 Earnings Presentation webcast. Pharma and Medical Devices make up the lion share of Johnson and Johnsons’s sales.
Number crunching
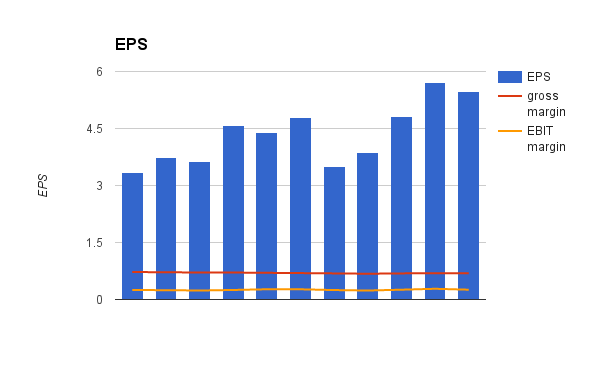 Eps, Gross margin and EBIT margin 2005 – 2015
The EPS since 2005 has grown a total of 63%, with an average of 6.23% per year. The margins are very stable, gross margin is down 3 % units from 2005 levels at 72% to 69%. EBIT margin is 25%, up from 24% in 2005. The averages over the ten-year period is 70% and 25.5%. I like these margins, they are very stable, barely moving during the financial crisis.
 Solidity, ROA, ROE. 2011-2015
Johnson & Johnson’s solidity is quite stable, hovering around 46%. Return on total assets is up from 8.5% to 11.5%, which indicates an increase in efficiency. Return on equity stays in the region of 17%. J&J is very solid, and they have a Aaa credit rating (although it is important to remember what rating Lehman Brothers had just hours before the crash). I like the increase in ROA, and the ROE is attractive.
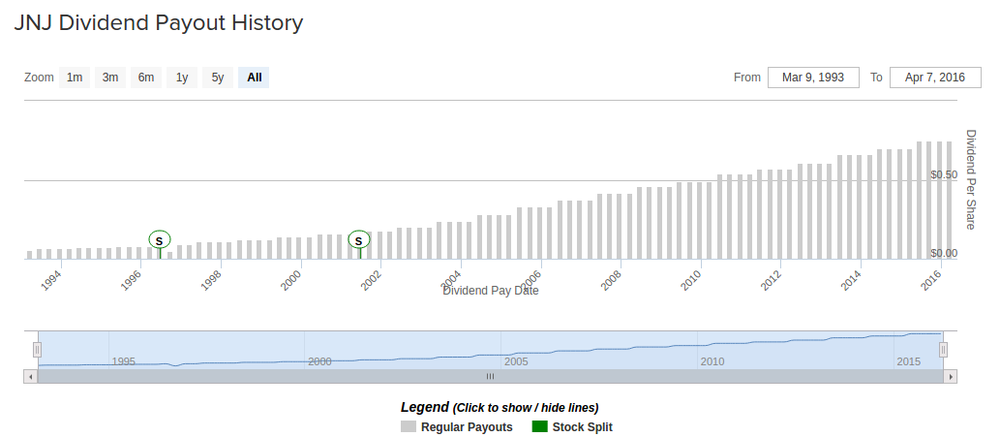
One of Johnson & Johnson’s main attraction, its dividend history. Take a look at this!
As you can see Johnson & Johnson has a formidable dividend history. Annualized the 2016 dividend is 3 USD. Which would mean a 0.05 USD increase from 2015. Or 1.7%. From 2011 the dividend has increased a total of 33%. Johnson & Johnson have paid dividends every year since 1970 according to Divdata.com! That’s 46 years of dividends!
Compared to peers
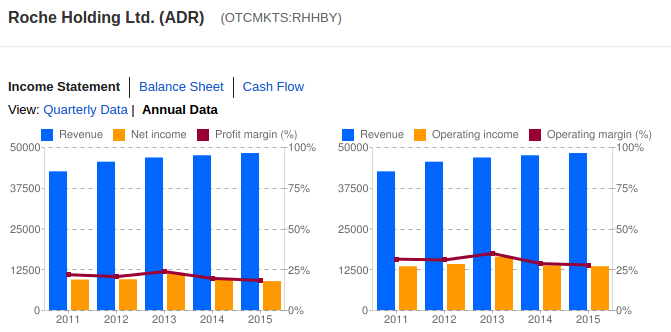
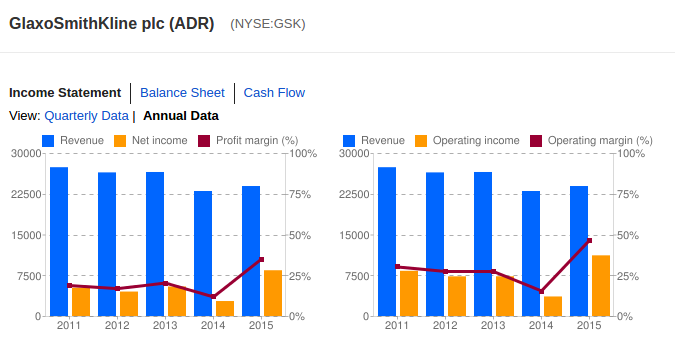
The peers I chose are Pfizer, AstraZeneca, Merck & Co, Roche, and GlaxoSmithKline. The following graphs show the annual income statements and come from Google Finance. Thanks Google.


Both Pfizer, Merck and AstraZeneca shows a bad sign in form of steadily declining Revenue, not good in my book.
Pfizer has still maintained its operating margin and operating income, but the net income has declined as well as the profit margin. This does not look very attractive in my opinion.
In AstraZenecas case its combined with a falling income AND a falling margin. For 2015 the net income was up which means an increased margin, but I don’t like those previous years of decline.
Merck has had some swings in income and margins and it seems to be quite low. I can’t explain the swing of the margins and the income and that’s why I would not feel comfortable investing in Merck.
Roche has increasing revenue which is great, but the net income is not quite keeping up. The operating income is stable and Roche has an operating margin of solid 25%. The net income is, as I said, not quite keeping up to the increase in revenue. Which leads to lower profit margins. This can be due to infectivity or increased competition.
GlaxoSmithKline has had a small decrease in revenue, but we can see a big bump up in the operating and net income for 2015. I have no explanation for this but if its lasting GSK is a potential candidate for a deeper analysis.
For Johnson & Johnson we can see a steady increase in revenue as well as income and margins. Isn’t it beautiful.
I have not personally cross-checked that Google Finance has the correct numbers for any of these companies, but I assume they have the correct figures.
Closing thoughts
First of all, I’m going to admit that I break one of my investing rules by investing in Johnson & Johnson. Because honestly I don’t fully understand the medical devices or pharmaceutical industry. However Johnson & Johnson’s history gives the picture of competence and the increasing revenue combined with an increasing net income and profit margin is very impressive! Their dividend history is simply astonishing and it gives the picture of a stock-owner friendly company.
Valuation
According to Reuters, Johnson & Johnson’s 5 year highest and lowest P/E ratio is 19.2 and 18. The industry has highest and lowest P/E in the last 5 years of 41 and 17.88. JNJ s current P/E(ttm) is 20.11 according to Reuters.
In the Q4 2015 Condensed Consolidated Statement of Earnings JNJ presents a diluted EPS of 5.48 $ per share. At P/E 18 and EPS of 5.48 one share would cost 98.64 $. Dividend Discount model with a required rate of return of 9% and a dividend growth at 6% gives us a price of 100 $ per share.
Conclusion
Johnson & Johnson looks like a very competent company, they have a great history of paying dividends and growth. The Q1 Report for 2016 signalled quite weak growth, only 0.6 % increase in sales compared to Q1 2015. The EPS for the first quarter 2016 was up 0.7% compared to the first quarter 2015.
The value seems to be somewhere around the levels of 98-100 $. Currently Johnson & Johnson seems expensive at P/E 20 and a lower yield.
I like Johnson & Johnson and I currently own 10 shares of JNJ. That makes JNJ have 10 % of the value in my portfolio, and the make up 7% of my annual dividends.
With that said, I hope you enjoyed this analysis! Tell me if you think I missed anything, and what you think of the company! Have a good day, make wise decisions!
-Samuraimannen
Remember that these are only my own personal opinions, and remember to always do your own analysis!
Sources
http://www.jnj.com/ http://www.janssen.com/products http://www.morningstar.com/stocks/xnys/jnj/quote.html http://www.dividend.com/dividend-stocks/healthcare/drug-manufacturers-major/jnj-johnson-and-http://www.investor.jnj.com/sales-earnings.cfm https://www.dividata.com/stock/JNJ/dividend http://www.reuters.com/finance/stocks/financialHighlights?symbol=JNJ
