I first wrote about Embracer in august of 2021. It was then one of my most popular write-ups, and one of the most in-depth write-ups I had ever done. Since the start of 2022 Embracer has declined by about 16%, but is the stock cheap now?
Since my write-up of Embracer, a lot of things has happened with the company. Lars Wingefors always seems to have a high pace, here’s some of what’s happened. All of the large acquisitions from last year have been consolidated into the accounting. The total number of studios, external and internal has increased from 136 to 181. The total number of IP’s has increased from 247 to 815(!). They have added another operating unit in the business area Games: Asmodee. The market cap has gone from 89 billion SEK to about 92 billion SEK, while the share price decreased from the 90’s to about 80 sek/share. They have gone from a net cash position to carrying net debt on the balance sheet which increases the EV from 76 billion to almost 113 billion SEK. So where are we now?
Adjustments
What is an Embracer analysis if it does not contain adjustments and pro-forma figures due to the high pace of acquisitions. The latest report is the fiscal Q4 of fiscal 21/22, which was released in may of 2022. The only segment that is not fully consolidated is Asmodee, for which we will be making adjustments. Finally, after the reported quarter Embracer took up 6 billion sek in debt and reported 10 billion SEK in total cash and credit facilities available. This was done to acquire a Square Enix’s western studios, along with a bunch of IP’s. We will be adjusting the latest balance sheet for these figures.
- Consolidating Asmodee
- Adjusting the balance sheet for 6 billion in added debt
Both of these adjustments are detailed in the fiscal Q4 report:
Asmodee
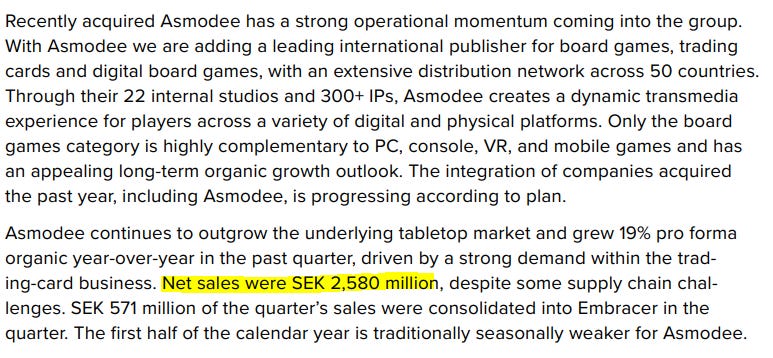
It is not incredibly clear from the wording in the Q4 report, but my interpretation is that Asmodee did ~2.6 billion SEK in revenue for the quarter. They are talking about the fact that the first half of the year is weaker, because fiscal Q4 is calendar Q1. However, only about 0.5 bn of this was consolidated into Embracers quarterly figures. Since calendar Q1 should be weaker, I think a conservative measure of Asmodee would be to take this quarter x4, giving us about 10 billion SEK in revenue for the full year. If we assume Embracers average operating cash flow margin of 30% is a bit high, we can use 25% to ballpark the Asmodee-figure. This lands us at the rough guesstimate of 2.5 billion SEK in operating cash flow from Asmodee.
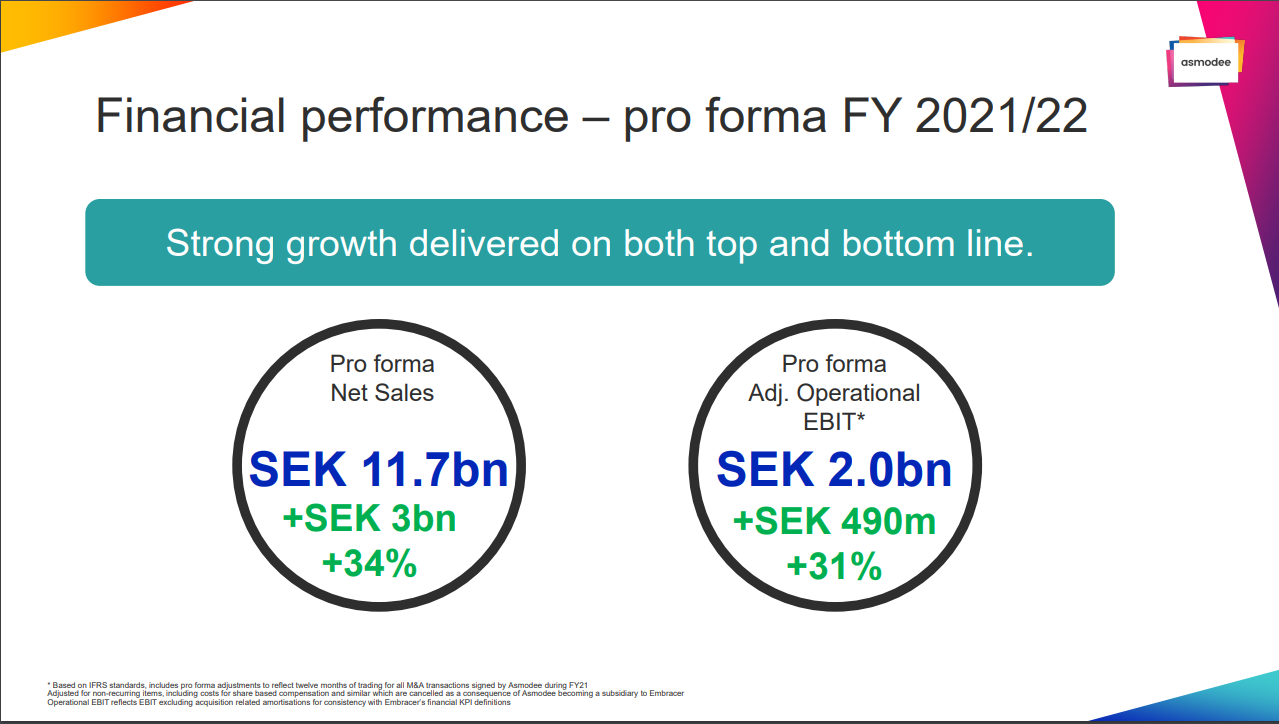
Update: reviewing the financials presented in the fiscal Q4 presentation, management points to pro forma revenue for Asmodee totalling close to 12 bn SEK and an Operating EBIT of 2 billion SEK. If we assume that Op. EBIT roughly equals operating cash flow, this represents a margin of about 17%. The figures in the following sections will be updated to assume trailing OPCF from Asmodee to be 2 bn SEK. Taking the 17% Op.EBIT margin and the fiscal Q4 revenue gives us ~0.44 bn in estimated OPCF for the quarter.
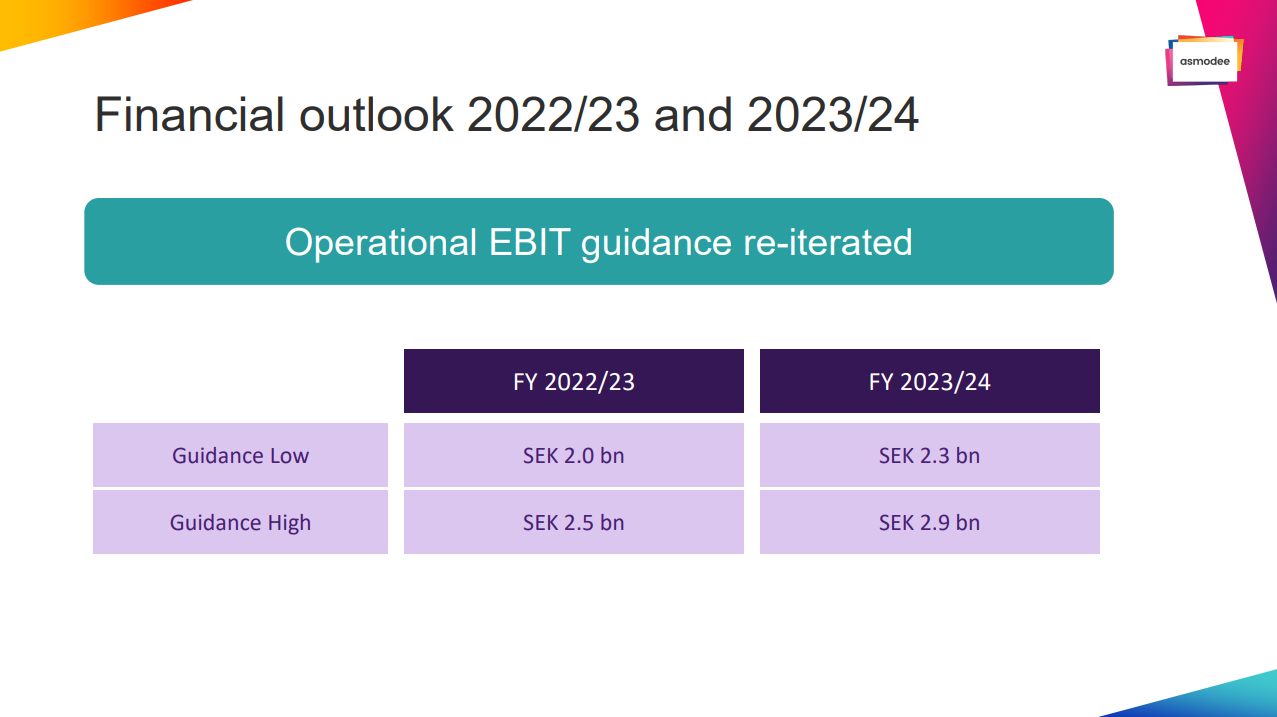
Looking at the management guidance regarding Asmodee, they give guidance for a growth in Op. EBIT of between 0% and 25% from the fiscal year of 21/22 to 22/23.
Square Enix western studios + IP’s
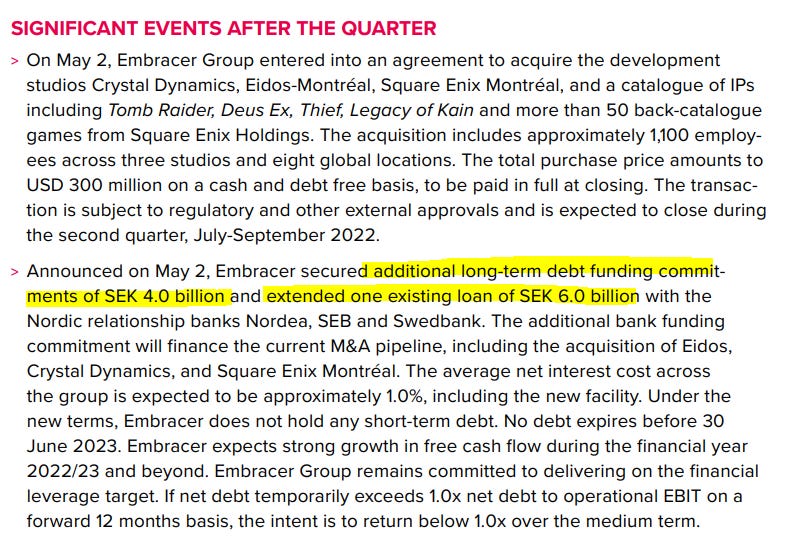
Cash position (from the press release announcing the above acquisitions, 2022-05-02):
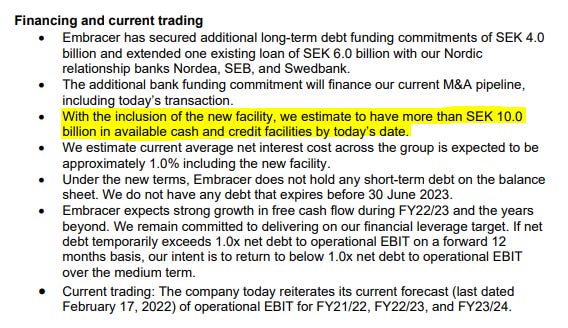
From the Q4 report and the press release of the acquisitions we can see that the debt should be increased by 6 billion and that the money available for acquisitions is 10 billion. I don’t know how much of this they have in cash, so I am using the cash from the fiscal Q4 and increasing the debt by the above 6 billion. Here I am interpreting “long-term debt funding commitments” as unused borrowing available.
Financials
The important reported figures are as follows:
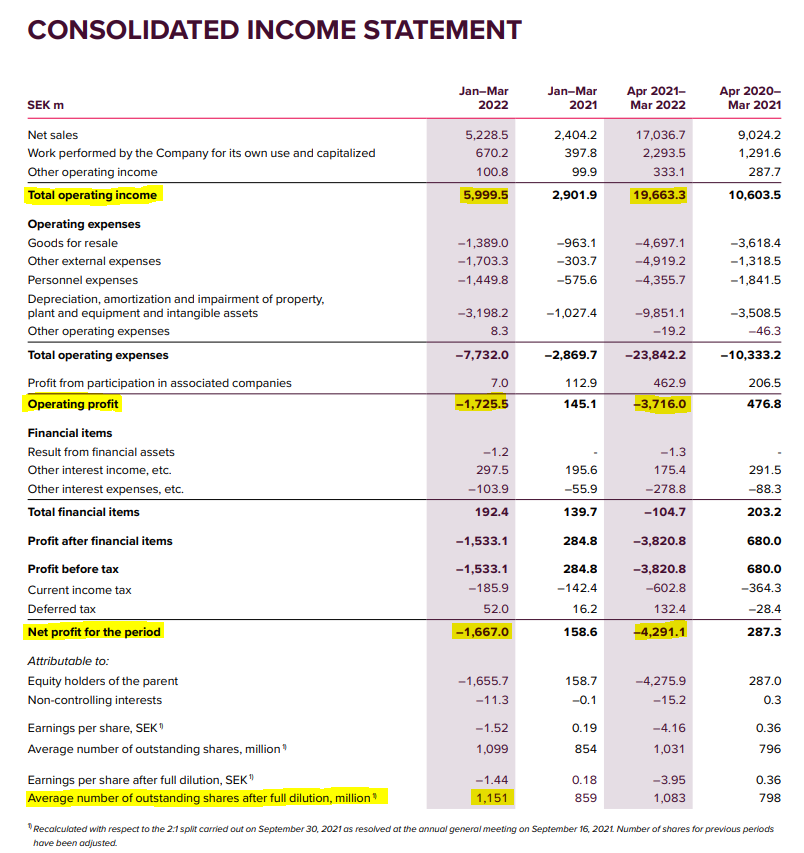
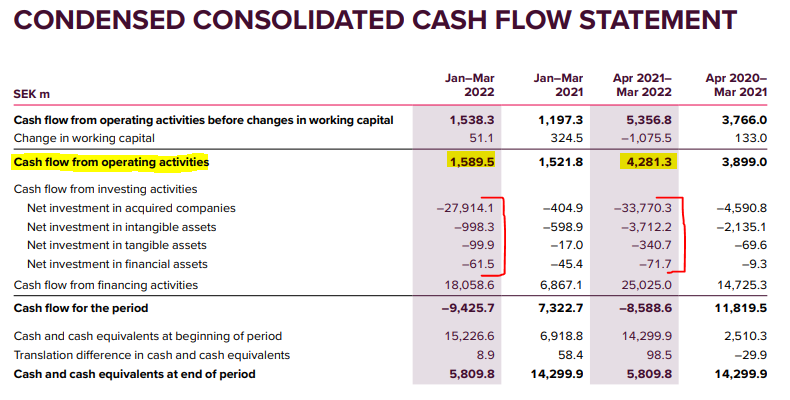
- Revenue: ~6 bn for the Q and 19.6 bn ttm.
- Operating Cash Flow: ~1.6 bn for the Q and ~4 bn ttm.
Adjusting for Asmodee (see above) leaves us with:
- Revenue: ~8.6 bn for the Q and ~31.6 bn ttm.
- OPCF: ~2 bn for the Q and ~6 bn ttm.
This would mean an operating cash flow margin of about 19% which is below the 30% average since 2016. I don’t think this is wildly inaccurate and it is more conservative than using the average.
Looking at the balance sheet we see the following:
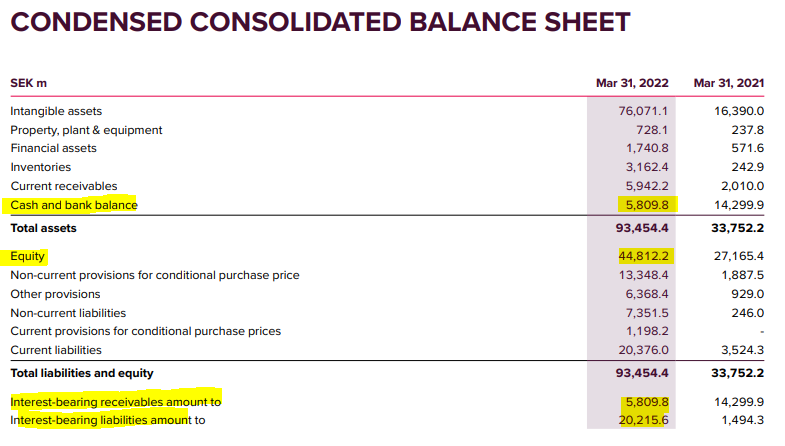
The reported total interest bearing debt is ~20.2 bn, and adding the 6 bn (see adjustments above) we get 26.2 bn of debt. Deducting the reported cash of 5.8 we get a net debt position of 20.4 bn sek. At the current share price of 81 kr/share and total share count fully diluted at 1.151 m shares, we get a market cap of 93 billion. Adding the net debt gives us an EV of about 113 billion.
Valuation and Conclusion
This gives us a valuation as follows:
- EV/OPCF(adj. ttm): ~19
- EV/OPCF(adj. fiscal Q4x4): ~14
Given the uncertainty in the case, mainly due to the high pace of acquisitions I’m not buying Embracer at this valuation. I’m not sure at what valuation I’d throw myself the the company, but 19x EV/OPCF isn’t it. The current volatility in the stock price could give a good opportunity, so I am definitely going to keep a more watchful eye on Embracer.
Valuation on management guidance of Op.EBIT
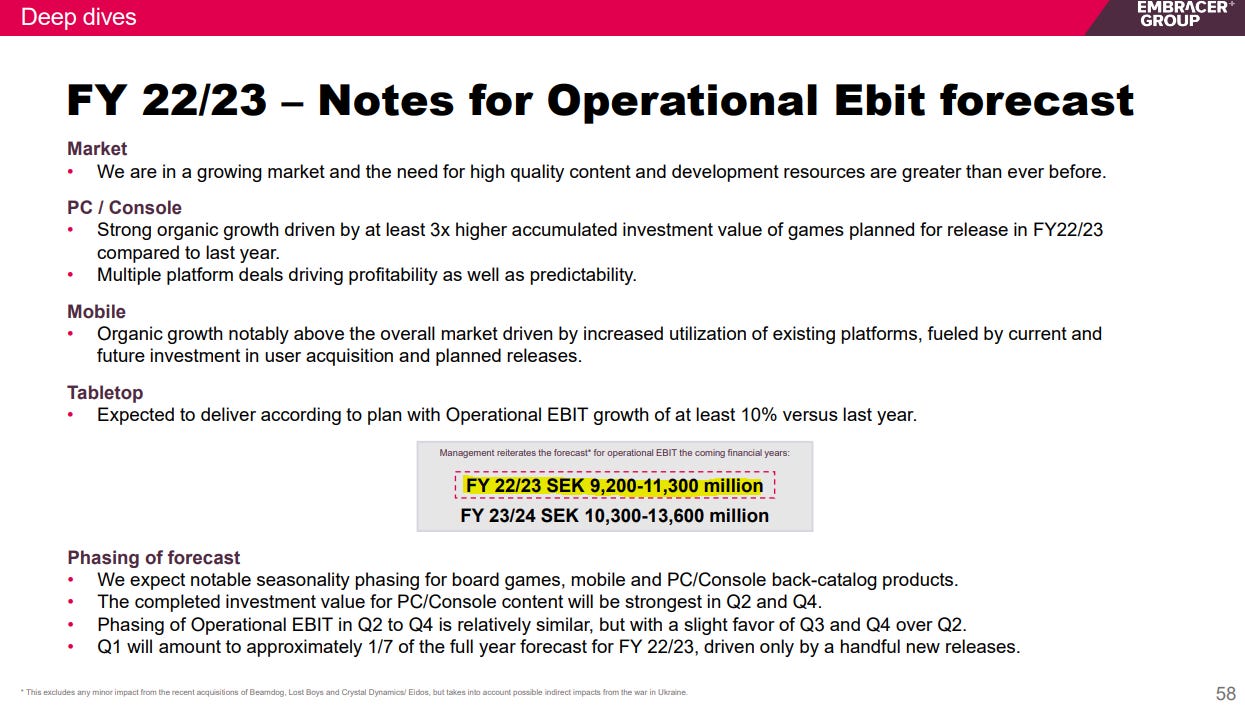
Looking to management guidance on Operating EBIT for the next fiscal year 22/23, the midpoint in the guidance is 10.250 billion SEK. This gives us an EV/OpEBIT(22/23) of 11. Compared to the trailing twelve months reported OpEBIT of 4.4 bn, this would represent a 130%+ growth rate. And compared to my pro-forma ttm OPCF this would be a growth rate of about 70%.
The same issue still applies as in the valuation on OPCF. Embracer are investing many times the Op. EBIT each year. They are also issuing a lot of shares to fund these acquisitions. So this makes it incredibly difficult to estimate what the Op.EBIT per share will be next year. I will admit that 11x Op. EBIT looks cheap, but I don’t know if it actually is cheap.
Discussion
As in my earlier write-up, the biggest problem with Embracer is the insanely high acquisition tempo it insanely difficult to know what Embracer will look like next year. The investments made just in the last year are many times larger than the operating cash flow. And it has been this way ever since they started ramping up in 2018-19. Because of this high investment tempo, I want a large margin of safety. This is because all the operating cash flow, and more, is going to purchases that are quite difficult to evaluate. Also, because of the incredible tempo, it is really difficult to evaluate PAST acquisitions. I stay a firm believer that OPCF is the safest way to value Embracer, but it also comes with a component of evaluating the return on the investments made. This includes both investments in game development and acquisitions. According to the chart of the ROI on game investments, Embracer are generating quite good returns, but I have no real clue if the acquisitions are either very good or very bad. On average, I think Embracer are making quite average acquisitions. If we take the latest, largest acquisition Asmodee as an example (from the acquisition press release 2021-12-15:
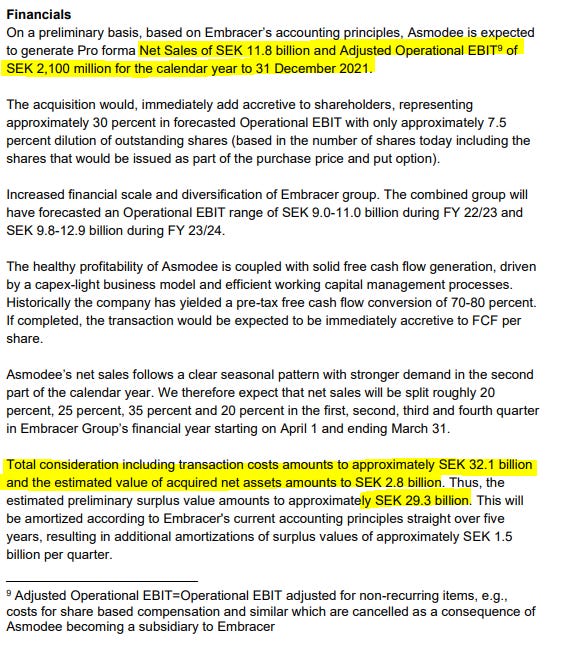
Embracer are paying about 29 billion SEK, for a company doing about 12 billion in revenue and 2 billion of Adj. Op. EBIT. This is 2.4 times sales, and 14.5 times Adj. Op. EBIT. This is not cheap, as Op EBIT probably is closer to an EBITDA measure than a measure of EBIT. Embracer themselves are currently trading at similar multiples, and I don’t think Asmodee would trade at a higher multiple if it would be publicly traded.
Op. EBIT
Since I mentioned it in the section above, I might as well talk about “Op. EBIT”. This is the measure that Embracer created in 2019 to more accurately depict the company’s profitability. It takes EBIT and adds back acquisition related depreciation and amortization. Take a look at this little diagram I created, depicting Op. EBIT/share, EBIT/share and OPCF/share per calendar year:
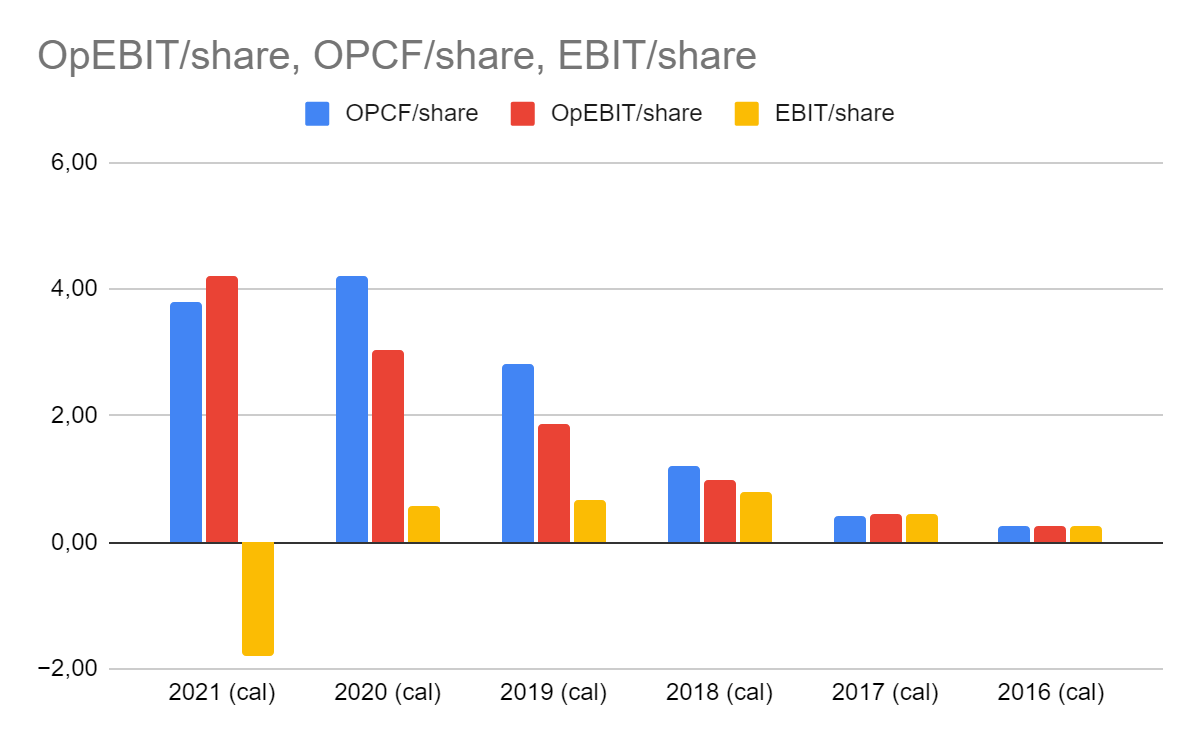
Notably, 18-19 EBIT/sh declined while both OPCF/sh and Op.EBIT/sh increased. This continued up until 2021 when OPCF/sh also decreased, while Op.EBIT/sh kept increasing. One thing to note is that OPCF/sh didn’t decrease because OPCF decreased. Both OPCF and the share count increased from 2020-2021, its just that the share count increased faster than OPCF increased.
I think Op-EBIT should be thought of more like an EBITDA figure than a figure of EBIT, and I don’t think either EBITDA or Op.EBIT are great figures for valuing a company.
The End
I hope you liked this edition of ValueTeddy’s Write-ups! If you want to suggest stocks for me to look at, you can tweet @ValueTeddy, and do check out valueteddy.com. Please note that this is in no way a recommendation or financial advice and I’m not your financial adviser. At the time of writing I do not own any shares of Embracer.
Thanks to @JBBInvest for pointing out that the consolidation of Asmodee only included a small part of the quarter, which I had missed when talking about the stock on Twitter. Also thanks to @EmbracerInvest and @Lejooon for pointing out some mistakes in my original text. I have since corrected some mistakes and added some discussion on the valuation.
