Part 0: Intro
I recently took some time to make a broad comparison on some of the Swedish real estate companies. Right now is probably not the best time to enter, but I hope that this comparison can act as a good piece of preparation if the broad downturn in market sentiment towards real estate continues.
What is this comparison looking at?
I have decided on using the Property Management Result (pre tax earnings before changes in property and asset values), and Cash Earnings (Property Management Result less dividends to preferred shares, D-shares, and hybrid debt). I also compare the reported figures on interest coverage, average interest rate paid, and average fixed rate term. Finally I look at the net interest bearing debt (long term + short term, less cash and equivalents), and a rough look at the property portfolio segmentation.
Selection of companies
The selection of companies to look at was made in part from memory of interesting real estate companies, and then I was aided by the list of the most owned real estate stocks on Avanza. Finally some followers have sent wishes for companies to be included.
Shortcomings
First of all, this is just an overview, so it is missing a lot of important detail. One detail in particular is that it does not at all look at the ownership structure. This is important, because some of these companies are in quite interesting ownership constellations. For example, Corem is owned by Rutger Arnhult, who also controls Castellum. Another example is Nyfosa whose largest owner is Sagax, which is controlled by David Mindus. A final example is SBB, whose largest owner is the very vocal CEO Ilija Batljan, who has been criticized by the activist short seller Viceroy.
Furthermore, this comparison only looks from 2019 and to the rolling 12 month period as of Q1 2022. Ideally I would go back as far as possible, but we all have our limits.
Another point of missing detail is that I only look at the broad categories of properties, and not in detail for each company. I also don’t look at the geographic segmentation for each company, which is important in some cases where they are very concentrated in one city or region.
Another very important part is that this comparison completely disregards the property development part of these companies. Some have no, or insignificant property developments, but others have very significant parts of the book value in property development. Most affected is probably K2A, and this comparison becomes very unfair to them. For this reason I will almost ignore K2A in this comparison.
Furthermore, the comparison on the debt side is very cursory and in order to really assess the debt level and understand when the debt has to be refinanced you need to look more in depth than just the average figures. The maturity tables are usually good enough, but this comparison will not look that deep.
Finally, I’m not looking at per-share figures, which causes significant changes to the growth rates in the tables below. This is the most pressing issue of this comparison, and when I update this, I will also include the share count over time.
Part 1. Property management result and cash earnings
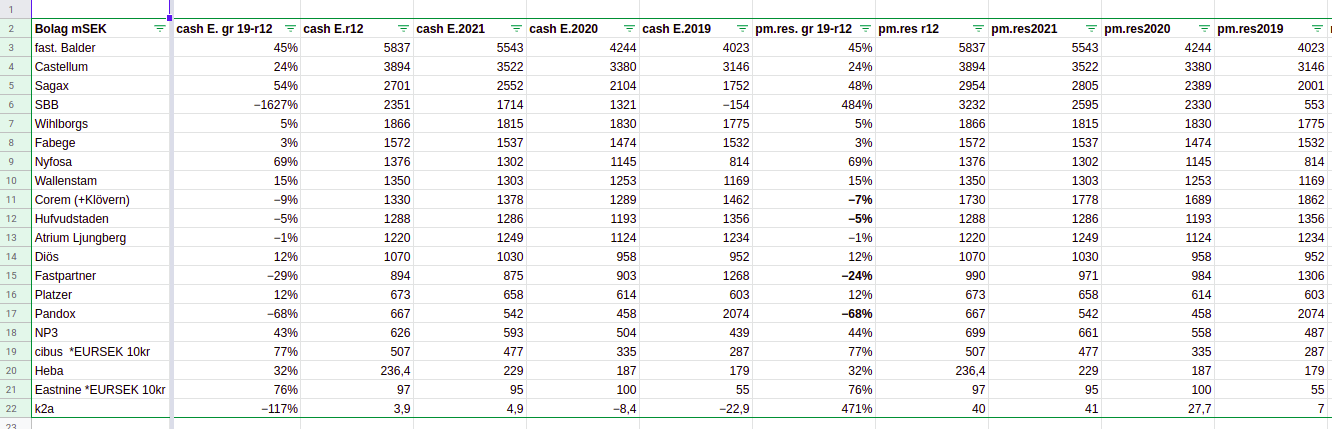
This part is probably the bulkiest part of this piece. Here I looked at the reported(*) profit for the property management. This should measure how profitably the companies are managing their properties, and it excludes the effect of changes in property values and tax. In some companies the changes in property values is a very significant part of net earnings. The * attached to “reported” is because property management earnings is not an IFRS (or GAAP) figure. In most cases, this is fine, but it gets dangerous because there are differences in how some companies choose to handle their joint ventures. Using joint ventures is not uncommon, or weird, but when properties in the JV change value, some companies choose to a) not define how much of the profit in the JV is changes in values, and b) don’t report “property management adjusted for changes in values in JV’s”. On the other hand, some companies are very clear on point a, and clearly state a PM-earnings adjusted for changes in values in JV’s. So, the figure “pm.res.XXXX” refers to the property management earnings adjusted for changes in values in JV’s.
To get to cash earnings, I deduct the dividends paid to preferred shares, D-Shares, and Hybrid debt. This is because these are senior to equity, but are not accounted for as interest expenses. Most companies in this list only have A and B shares, but some rely heavily on these sources of funding.
The table above is sorted by size of cash earnings, largest first. It is quite clear that this is quite a mixed bag of companies, the largest being Balder and the smallest is K2A. There are six companies that utilize preferred shares, D-Shares, and/or hybrid debt. The largest non-common stock dividends are paid by SBB, which pays 880 m SEK out of about 3200 m SEK in pm. res. In other words, close to a third of the pm res is paid to non-common stock equity. (K2A pays about 90% of their pm res in dividends to preferred shares, but for the reason stated in the intro, this might be a very unfair comparison). NP3, Sagax, and Fastpartner all pay about 10% of their respective pm res in dividends to preferred shares, D-shares, or hybrid debt. Corem pays the second most, at about 400 m SEK. compared to about 1700 m SEK in pm res this is about 25%.
For this selection of companies, the growth rates are all over the place. Again, note that this is not per share figures, which in some cases are vastly different. Looking at the growth from 2019 to the rolling 12 month period ended in Q1 2022, the highest absolute growth is achieved by SBB, which went from -150 m in cash earnings (CE), to about 2300 m SEK in CE. On the other side of the spectrum we have Pandox. Which lost more than 66% of their CE. This might be weird, but it is explained in its entirety by the fact that all their properties are hotels.
Part 2. Debt
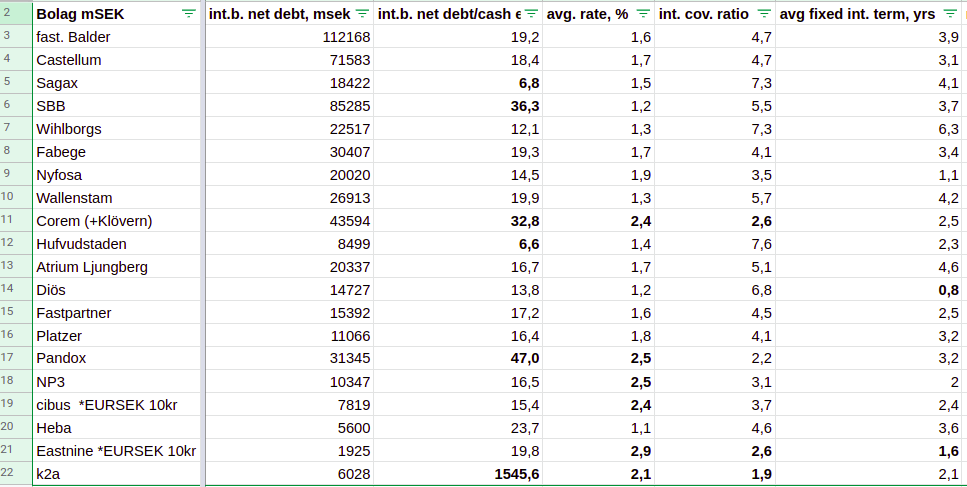
Looking at the debt side, we again see some spread in the figures. For a measure of the debt level, I am taking the net debt over the cash earnings. Sagax and Hufvudstaden stick out with very low debt levels. On the other side we have K2A, Pandox, Corem, and SBB. K2A again is due to their relatively poor comparability in this particular comparison. Pandox debt level looks high because their cash earnings have been down the drain since the pandemic. Corem and SBB both stick out in a more interesting way. Both probably have to work a bit to decrease this debt level, and as far I know both have been selling some properties to do this.
Looking at the interest part, Heba, Diös, and SBB have the lowest interest coverage ratio. This is the reported interest coverage ratio, and I have not dug deeper into each company and how it’s calculated exactly. Looking at the average rates and the average rate binding, a few stick out with average rates over 2%. Furthermore, Diös sticks out with a record short interest binding at less than a year. This could be problematic depending on how much of the debt that has to be refinanced, if rates are going to keep increasing. Some companies stick out on the other end of the spectrum with rates bound on average for more than 4 years. Again this is just the reported average fixed rate term, so for a more in depth understanding on the rates and terms of the debt you have to look closer at each report.
The debt level is important because a high debt level can hamstring a company. A very low debt level can provide flexibility, but it is also not maximizing return on equity. The rates are important, because as someone put it, real estate companies are “inverse banks”. They have interest on the costs side, and real estate yields on the income side. If rates increase to above the yield on the price paid for the properties, they are going to have a negative ROI until they can decrease the interest expenses. For some companies, this is a higher risk than in others, because of the prices they have paid for their properties.
Part 3. Property portfolio segments
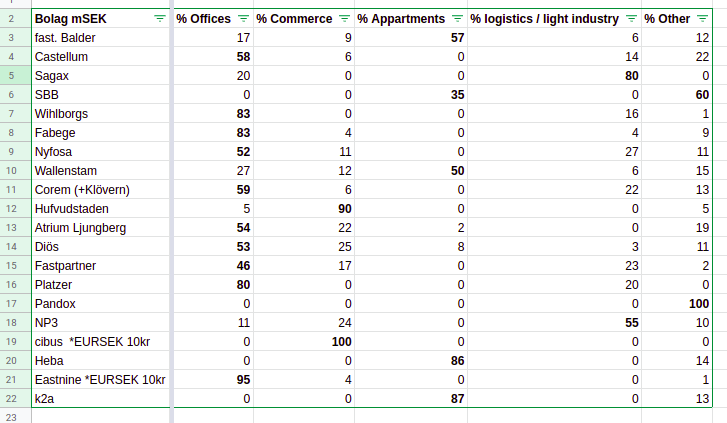
This is probably the least important part, but it’s still somewhat interesting. As mentioned earlier, this is missing the geographical segmentation, which could probably be as important as the type of properties. All of this data is roughly taken from the reports, in most cases based on how the rental income is divided, and others based on how the value of the properties are divided.
Most of the companies in this comparison have a significant part of their portfolio in offices. Apartments are interesting in that the ones that have apartment buildings have a significant portion allocated there. Others most have no exposure to housing or apartments.
Some companies stick out, namely Sagax, SBB, Pandox, Hufvudstaden, Cibus, Heba and K2A. Sagax are focused on logistics and lighter industrial properties. SBB are focused on schools, governmental buildings, etc (all lumped into others). Pandox only own hotels. Hufvudstaden mainly own commercial properties in central Stockholm. Cibus are focused on owning properties for grocery companies in Finland and Sweden. Heba almost only owns residential properties, and K2A are focusing on developing and owning student housing properties.
Part 4. Valuations
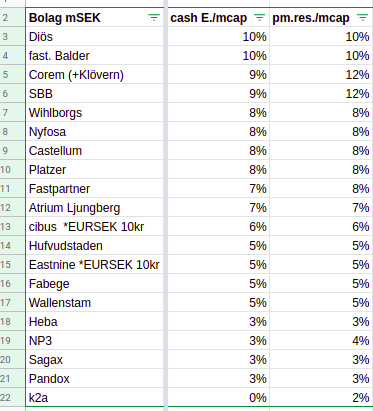
Now we have reached the most interesting part of this comparison, the valuation. The difference between the two images is only the sorting. In the first image the sorting is the same as in the previous categories (largest by pm result first) and in the second image the companies are sorted from highest yield to lowest (higher yield = lower valuation).
Again, I think we just have to exclude K2A because this comparison is so unfair to them due to their large part of development properties.
I notice quite a huge spread between the cheapest and most expensive companies, which is quite interesting. I don’t understand why Pandox is so expensive, since their pm result and cash earnings are yet to recover from the covid hit. At this valuation, markets are easily pricing in a full recovery quite soon. Another interesting valuation is that Eastnine seems to have no discount attributed to it, even though it arguably should be cheaper due to their focus on the Baltic countries. I am surprised that Balder looks so cheap, because I thought it was quite a darling among Swedish investors.
Part 5. Conclusions
What are the (if any) conclusions we can draw from this? Well, maybe it is a good place to start if you want to own any real estate company in the Nordics right now. However, I am quite unattracted to the sector as a whole, because of the looming presence of rising interest rates, fading business cycle, fears of recession, and the overall risk of lower valuations in a bubbly real estate market.
Given my relative adverseness to real estate currently, what if I had to pick some stocks from this list? Well, if I had to put together some sort of portfolio using only these companies, and no hedging etc. then I would probably do something like: Ignore anything yielding less than 7%, and ignore the most indebted companies. This lets us exclude almost half of the companies, and we have the following left: Diös, Balder, Wihlborgs, Nyfosa, Castellum, and Platzer. With a gun to my head, these are the stocks I would put in a real estate portfolio using the data from this comparison (as of 20th of June 2022). As far as weighting, I would probably go with a somewhat equal weighting.
Bonus: How to value a real estate company?
I think it’s clear that only using yield to value these companies completely disregards the potential value in assets that are not currently throwing off cash, such as land, properties under development, and building rights. A more complete valuation comes from first valuing the cash flow (multiplying the cash earnings by a fair multiple) and then adding back the estimated value of the other stuff. Then comparing that value with the current market price for the company.
With that, thank you for reading. I have no clue if any of this is actually interesting, but hopefully it can shed some light on the Nordic real estate market. I hope you liked this edition of ValueTeddy’s Write-ups! If you want to suggest stocks for me to look at, you can tweet @ValueTeddy, and do check out valueteddy.com. Please note that this is in no way a recommendation or financial advice and I’m not your financial adviser. At the time of writing this, I do not own any of the stocks mentioned.
